I’m anticipating a contraction in economic activity over the first two quarters of 2020 that roughly matches the longer decline over the financial crisis.
When shuttered industries and shut‑in workers can start the transition back to normal life—probably sometime in May—growth should resume.
Solid pre‑virus underpinnings in the business and household sectors and the unprecedented policy response should help short‑circuit a prolonged recession.
Severe restrictions have been imposed on roughly half of the country, and government‑enforced social distancing measures, including stay‑at‑home orders, are likely to proliferate in the near term. I currently anticipate that the breadth of measures in place—and their drag on economic activity—will reach maximum intensity during the first half of April.
From that point, output should have nowhere to go but up, at least as far as the coronavirus’s impact is concerned. From this perspective, recovery will begin once virus mitigation has progressed to a point that social distancing restrictions can be moderated. I’m assuming that this gradual return to work will begin sometime in May.
Unprecedented Quarterly Declines, but Concentrated in March and April
The impact of this sudden halt in economic activity on second‑quarter growth is likely to be unprecedented. The consensus forecast1 of a 10.8% decline in real GDP growth (at a seasonally adjusted annual rate) would be the sharpest one‑quarter decline in the 72‑year history of the series.
I would stress that the uncharted territory in which we find ourselves means that any outlook is exceptionally uncertain. With that caveat, I see downside risk to the consensus forecast, arriving at a 15% second‑quarter contraction based on the following assumptions:
I would expect activity to contract by about half from February to April in transportation and warehousing, education, arts, entertainment, and accommodation and food services. Recovery would then start with 10% monthly increases in activity in these sectors in May and June.
Other sectors should fare better. Manufacturing activity might shrink around 20% in the second quarter, while health care services activity will probably expand by 30% in March and hold that level through June. Government spending should increase 10% in March and also hold that level through June.
If these ballpark assumptions hold true, the cumulative result would be a 4% first‑half contraction, roughly on par with the 2008–2009 recession, which stretched over six quarters.
Longer‑Term Recession Drivers Appear Absent
Recessions typically entail the correction of imbalances, often associated with excessive demand—whether in fixed investment or consumer spending, or both—that has undermined private sector finances. In contrast, as is well understood by now, the current downturn is being driven substantially by an enforced pullback in activity in the name of social distancing and virus mitigation. The unique nature of this downturn suggests it will be more dramatic but shorter than usual.
Business Capital Spending: No Obvious Overhang
The unfolding reduction in output will surely be echoed in falling business capital expenditures (capex), at least in the very near term. But the pullback is not coming from a high level, in large measure because of last year’s manufacturing recession, which was ending when the coronavirus emerged. Net investment fell sharply over the course of last year and likely slipped in the current quarter. This adjustment appears to have slowed annualized growth in the business capital stock last year to the low end of its recent range, or about 1.8%, as in 2016–2017. Even before the impact of the coronavirus, the capital stock was poised to grow by little more than 1.5% in 2020—the slowest pace since 2011.
The relatively slow recent growth in the capital stock argues against the notion that business capex has run ahead of the economy’s underlying needs. Neither has capex gotten ahead of the business sector’s financial capacity. Approaching the previous two recessions, the business sector’s financial balance—undistributed profits less capital spending—was deteriorating and becoming increasingly negative. In contrast, the financial balance was close to zero as of late 2019, not indicative of a need to slash capex.
To be sure, capex in sectors taking the most direct hit from the pandemic—including education, arts and entertainment, recreation, accommodation, and food services—may grind toward a halt in April. Yet we should also recognize the possible offset from increased capex in chemical manufacturing, which includes the pharmaceutical industry, and health care services. The former set of industries account for 10.1% of total business capex, while the latter account for 10.4%.
Housing: Nothing to Cut
Housing starts and sales maintained their recent upward trend through February, but sharp recent declines in indexes of mortgage applications signal a near‑term drag on housing activity as a result of enforced social distancing. Still, there is relatively little fuel for downside momentum if the labor market correction subsides once the coronavirus is contained. The recent expansion remains exceptional in the absence of housing supply (new home starts) outpacing demand (household formations).
Interrupting the Typical Recession Dynamic
Despite sturdy initial conditions in private investment sectors, a more typical recession dynamic could be propagated from near‑term layoffs and subsequent consumer spending cutbacks. A record 3,283,000 Americans filed jobless claims in the week ended March 21, and many more are claims are undoubtedly coming as more restaurants and other consumer services businesses shut down.
The newly unemployed buy less of everything, including products of industries not at all directly affected by the virus. Those industries, facing less demand, reduce capacity, including through headcount. Nevertheless, I anticipate that this secondary drag on growth will be handily offset by the primary contribution from the post‑virus containment return to work.
Unprecedented Monetary and Fiscal Response
Monetary and fiscal policy have both responded promptly and forcefully to cushion the blow from mandated reductions in economic activity. The Fed has gone beyond its 2008–2009 playbook, with open‑ended purchases of Treasury, residential and commercial mortgage‑backed securities, liquidity support for the investment grade corporate bond market, and plans for a Main Street Business Lending Program. A USD 1.5 trillion package of tax relief and government spending is larger than the 2009 stimulus (7.1% of GDP vs. 5.5%), and funds should begin to flow by the third week in April.
Last week got off to a poor start as a US$2 trillion stimulus bill failed to clear a procedural hurdle in the Senate for the second time in two days, with Democrats objecting to a lack of transparency in how a US$500 billion loan programme would be used and overseen. Markets snapped back on Tuesday, however, after House Speaker Nancy Pelosi stated she was hopeful a deal would be reached imminently. At his daily press conference, President Trump stressed the need to act quickly and stated his hope the economy would begin moving back to normal by Easter (12 April).
Around midnight Tuesday, the White House and congressional leaders finally agreed on a US$2.2 trillion stimulus package, including US$350 billion in support for small businesses, along with US$1,200 direct payments to lower- and middle-income adults and US$500 per child. The bill also expanded unemployment insurance and provided additional funding for providers of healthcare services. The Senate passed the legislation unanimously (by a vote of 96 to 0) on Wednesday, the House passed the bill by a voice vote on Friday and President Trump signed the largest-ever US stimulus package into law.
The Federal Reserve expanded its own stimulus measures, boosting both equity and fixed income markets. On Monday morning, the Fed announced it was setting no limit on its purchases of Treasuries and agency mortgage-backed securities while also beginning to purchase investment-grade corporate bonds. In addition, the Fed revived the Term Asset-Backed Securities Loan Facility (TALF) – originally launched in 2008 – which is designed to support bonds backed by student and auto loans as well as other types of asset-backed securities. The central bank also said it was taking steps to assure the flow of credit to municipalities and announced plans for a lending programme for small businesses.
Glimmers of hope in the battle against the pandemic also seemed to support sentiment at midweek. New York Governor Cuomo stated on Wednesday that a slowing growth rate in hospitalisations may be evidence that social distancing could be working. Reports also surfaced of progress in developing home testing kits for the coronavirus. Economic data were predictably grim, however, with a record 3.3 million Americans filing for unemployment in the week ended 21 March.
Equity markets
The S&P 500 returned 10.3% (-20.7% YTD). Stocks rebounded from three-year lows, as investors appeared encouraged by further aggressive monetary policy actions and the passage of an unprecedented level of fiscal stimulus. On Tuesday, the Dow Jones Industrial Average had its best day since 1933, and the S&P 500 experienced its largest daily rally since October 2008, with all the major US equity indexes surging by around 9% to 11%. By the close of business on Thursday, the Dow had marked its best three-day stretch since 1931, although the major indexes surrendered a portion of their gains to close out the week on Friday.
Heavily beaten-down energy shares outperformed as oil prices stabilised somewhat – Brent ending the week at US$24.9 for a barrel – and US officials put pressure on Saudi Arabia to end its price war with Russia. Airline shares also bounced back at midweek as news arrived of a US$60 billion bailout package for the industry as part of the stimulus bill. Utilities shares were also strong, while communication services shares lagged.
Fixed income markets
US Treasury yields decreased as the Fed’s purchases of Treasuries and expanded funding, credit, and liquidity facilities aided market functioning. US 10-year Treasury yield declined from 0.85% to 0.68% over last week.
The Fed’s announcement that it will begin purchasing corporate debt in both the primary and secondary markets, as well as progress by lawmakers in approving an economic stimulus plan, supported the performance of investment-grade corporate bonds. The improved sentiment prompted many issuers to come to the market, and the volume of new deals reached the highest weekly total on record. The issuance was met with solid demand from domestic and overseas investors.
High yield bond investors continued to be mindful of cash balances due to the pace of recent outflows from the asset class. However, market sentiment improved as the week progressed amid strong equity gains in response to the federal government’s historic stimulus plan.
As the coronavirus crisis rattles the global economy, many investors are fleeing for the exits. But not us, and not you. We’ve built EXM for precisely these sorts of environments.
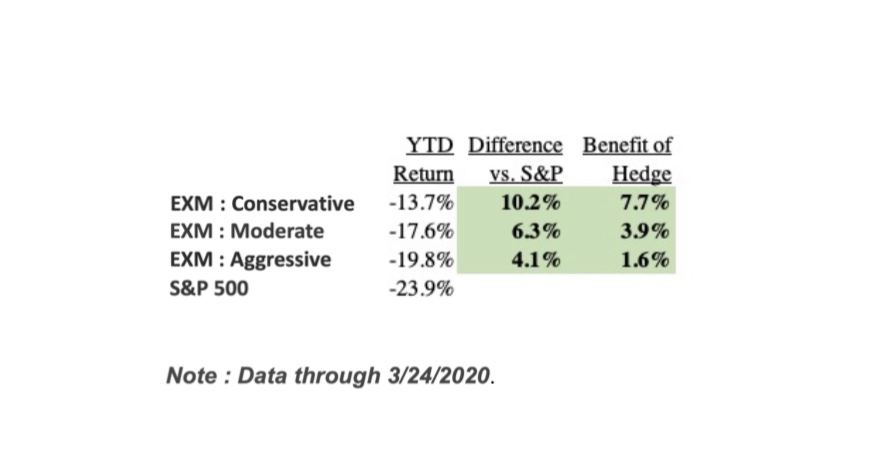
9 out of 10 EXM clients have been buying as EXM has outperformed the market average YTD across all risk profiles.
Below are a few takeaways on how we’ve been navigating the market and generating outperformance for you.
1) EXM clients have outperformed other investment managers this year. We are pleased with how well our 20 Flagship stocks have held up, especially since many are “higher beta” companies (i.e. historically higher daily ups/downs vs. the market).
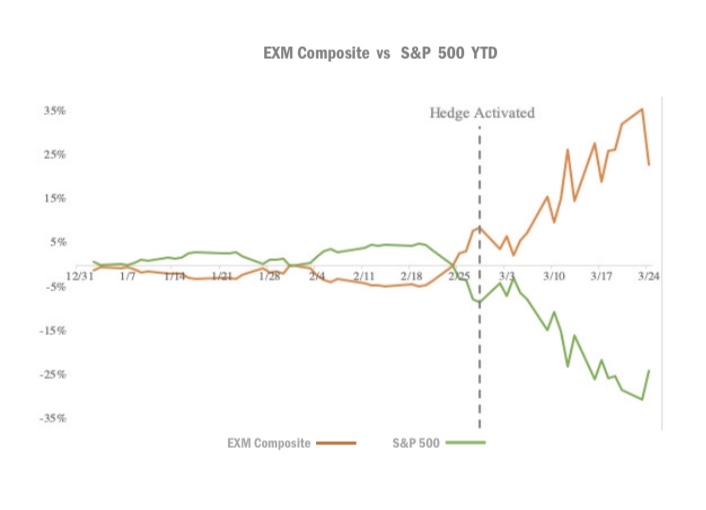
Our hedge is up +23% YTD and +13% since we activated full protection in early March, enabling our hedging strategy to add 2-8% return to your portfolio YTD (based on your risk profile), compared to if you had just owned the EXM Stock Composite
Combining the EXM stocks Composite (long) and the hedge (short), we’ve delivered 4-10% better returns for our clients this year vs. the S&P. Our hedge has delivered against its objective so far: earning you profits when the market enters a significant downturn.
We believe we’re well-positioned to manage your money through this crisis and continue generating outperformance vs. the market. Your EXM stocks Composite are durable, defensive growth businesses poised to weather a downturn, and your hedge is built to mitigate a further drawdown from here.
Why investors should take a closer look at the green bond market.
Key Insights
Growth of the green bond market expected to continue in 2020, led by sovereigns.
Germany’s willingness to issue green bonds is likely to act as a reference point for other issuers.
There is an opportunity to start integrating green bonds into fixed income portfolios
In our latest policy week meetings, we discussed the dynamics and trends of green bonds—one of the hottest trends in fixed income. One topic covered was how our portfolio managers are incorporating green bonds into their fixed income portfolios independently from the environmental, social, and governance (ESG) standards that are already in place across strategies.
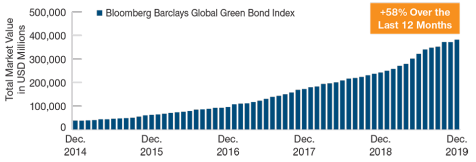
Since the issuance of the first green bond just over a decade ago, the market has gone from strength to strength. Last year, a record USD 255 billion of bonds were sold for the purpose of financing environmentally friendly projects and activities. That’s an increase of more than 45% from the previous year and more than three times the amount issued in 2016. “The environment has become a critical issue driving rapid growth in green bond issuance,” said Marek Bielec, a portfolio manager and member of the global fixed income investment team. “The market’s strong momentum looks set to continue as more and more companies and countries step up their efforts to turn greener.”
Several countries are planning to sell green bonds for the first time this year, including Italy and Sweden. More may follow in the future if governments are allowed increased flexibility in their fiscal and budget rules when borrowing to finance for green and environmentally friendly activities. “As many major central banks seem to have exhausted their ability to stimulate growth through monetary easing, developed market countries will likely embark on new fiscal easing—and it’s possible that green bond issuance is part of this,” said Marek Bielec
Green Bond Market Has Grown Steadily Since 2014
(Fig. 1) Total market value of green bonds
Green Bond Market Has Grown Steadily Since 2014
As of December 31, 2019.
Source: Bloomberg Index Services Limited (see Additional Disclosure).
“The market’s strong momentum looks set to continue as more and more companies and countries step up their efforts to turn greener “.
Marek Bielec, Portfolio Manager
Credibility Improving, But More Progress Needed
Any increase in green bond issuance would need to be met by investor demand. However, despite great strides made in the market, certain issues are still holding back the mainstream investors from participating. These include a lack of globally accepted standards and the lack of transparency around how the proceeds raised from a green bond sale will be used, particularly how it will be refinanced or paid back in the future. “A clearer explanation of the way the financing is used over time is needed to improve credibility around green bonds,” said Mr. Bielec.
Another development that could strengthen the market is the German government’s plans to issue green bonds across a range of maturity profiles. Mr. Bielec said, “A comprehensive German green bond yield curve could potentially be a game changer for Europe as it could serve as a reference point for other sovereigns and corporate issues denominated in euros.”
Not all governments are on the same page when it comes to selling green bonds, however. The UK debt management office, for example, has expressed concerns about the costs of building a liquid government yield curve of green bonds.
Better Liquidity Provide Opportunities for Investing in Green Bonds
Despite spectacular growth, the green bond market remains small in comparison with the overall size of the bond market, although its share is growing. One of the factors holding it back has been a lack of liquidity, but the investment team believes there are signs of improvement on this front. “The boom in green bond issuance is helping to increase their liquidity profile, which, in turn, should provide opportunities for portfolio investing,” said Mr Bielec.
Who Issued Green Bonds in 2019? (Fig. 2) Breakdown by issuer type and the five largest issuers
Who Issued Green Bonds in 2019?
As of December 31, 2019.
Sources: Climate Bond Initiative and EXM Capital estimates.
Any specific securities identified and described are for informational purposes only and do not represent recommendations.
” The boom in green bond issuance is helping to increase their liquidity profile, which, in turn, should provide opportunities for portfolio investing “.
Marek Bielec , Portfolio Manager
In a further positive sign, liquidity in the secondary market has picked up in the past year thanks to jumbo deals from France and the establishment of liquid “green” benchmarks in countries like Ireland. Against this backdrop, we believe it may be the right time to possibly start integrating a layer of green bonds into fixed income portfolios. “In the event we can identify a green bond with the same valuation characteristics as a similar equivalent conventional bond, it is likely to be considered as a preferred selection in some of our portfolios,” Mr. Bielec said.
Turning attention to the corporate sector, the team noted that green bonds issued in this market could become more attractive than conventional corporate bonds. “Some corporations have a vested interest in enhancing their green credentials as it will help diversify their revenue stream and ultimately improve their ESG scoring with investors,” said Mr. Bielec
Additional Disclosure
Bloomberg Index Services Limited. BLOOMBERG® is a trademark and service mark of Bloomberg Finance L.P. and its affiliates (collectively “Bloomberg”). BARCLAYS® is a trademark and service mark of Barclays Bank Plc (collectively with its affiliates, “Barclays”), used under license. Bloomberg or Bloomberg’s licensors, including Barclays, own all proprietary rights in the Bloomberg Barclays Indices. Neither Bloomberg nor Barclays approves or endorses this material, or guarantees the accuracy or completeness of any information herein, or makes any warranty, express or implied, as to the results to be obtained therefrom and, to the maximum extent allowed by law, neither shall have any liability or responsibility for injury or damages arising in connection therewith.
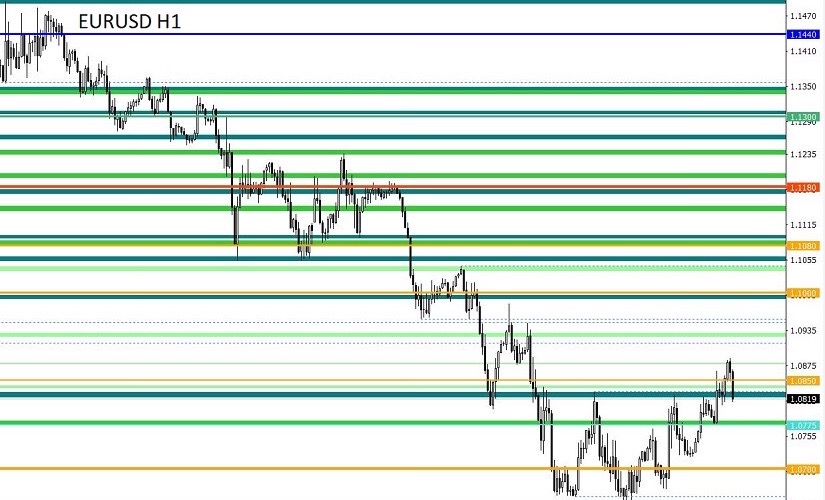
From a comprehensive analysis, we see a local upward movement relative to the specified framework. And now about the details. The market dynamics are still high, and the price concentration is maintained within the previously established limits. Special attention was paid to the following levels: 1.0650 – the base, where the minimum value is 1.0636; 1.0775 – the variable level, which plays a kind of mirror image; 1.0850 – the subsequent level, which played the role of a kind of resistance on periods earlier. In fact, we see a kind of correction from the lows, where there are outlines of ranges.
Regarding the theory of downward development, it was revealed that the variable support point of 1.0650 can be broken with subsequent touches, and this is confirmed by the continuing trading volumes on the downside. At the same time, the panic-inducing external background raises the boiling point, which can eventually serve as a kind of catalyst that will lead to an update of historical lows in the event of an escalation of fear of the consequences of the COVID-19 virus.
In terms of volatility, we are recording a similar indicator as last Friday, where the dynamics exceeded the daily average by almost twice. It is worth recalling that the characteristic acceleration has been going on in the market for more than a month, and there are no reasons for slowing down yet.
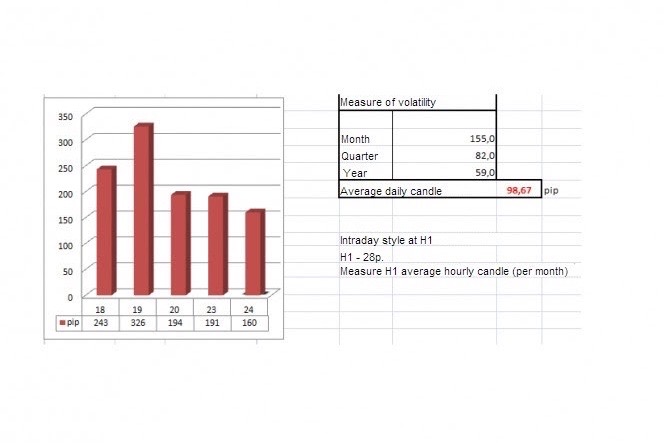
Volatility details: Monday-155 points; Tuesday-183 points; Wednesday-115 points; Thursday-278 points; Friday-166 points; Monday-151 points; Tuesday-234 points; Wednesday-243 points; Thursday-326 points; Friday-194 points; Monday-191 points. The average daily indicator relative to the volatility dynamics is 98 points (see the volatility table at the end of the article).
Analyzing the past day by the minute, we saw an attempt to resume the downward course, but the most notable moment was the upward surge at 14:00, which, in a matter of an hour threw the quote by more than 100 points. This behavior was of a local nature, where in the end the quote partially played back the existing surge.
Traders considered two options at once: the first one was counting on a further decline, but only if the quote managed to be fixed below the area of 1.0636/1.0650; the second option was considered in view of alternatives if the price was fixed higher than 1.0775 on H4, which eventually happened.
Looking at the trading chart in general terms (daily period), we see the first signs of a possible correction relative to the downward inertia course.
The news background of the last day did not contain important statistics on Europe and the United States, and all the market’s attention was focused on the external background.
In terms of the general information background, we see that the coronavirus continues to shock with statistics, where an increase of 41,758 cases of infection was recorded in the world over the past day. While in the United States, for two days, the increase in infected was 19,035, where against this background, US President Donald Trump insists on the adoption by lawmakers of a package of stimulating social and economic measures aimed at overcoming the consequences of the virus.
“The package must be accepted because the virus has a negative impact on our country. We are going to take a number of incentives to ensure that workers live their lives. This is not their fault,” Donald Trump said during a briefing at the White House.
I will specify that the stimulus package is about $2 trillion, which, in trump’s view, should support the economy and citizens of the country.
In turn, the head of the Federal Reserve Bank of St. Louis, James Bullard, gave his forecasts, which say that the unemployment rate in the US in the second quarter may reach 30%, and GDP will collapse by 50%.
The figures are extremely scary, but experts from Morgan Stanley agree with them, who predicts that the US economy will fall at an annual rate of 30% in the second quarter.
Today’s economic calendar has already published PMI data for Europe, where PMI fell so low that set an absolute record in the history of the EU. So, its indicators amounted to 28.4, which was never the case. The situation was saved by the index of business activity in the manufacturing sector, which also fell from 49.2 to 44.8, but this is still within common sense.
In fact, only the euro production index managed to increase its price locally.
In the second half of the day, similar PMI data will be released, but for the United States, where it is forecast that the index of business activity in the service sector will fall from 49.4 to 40.0, and the manufacturing index of business activity will decrease to 42.0.
Further development Analyzing the current trading chart, we see just the same local upward movement that was discussed above, where the quote manages to be fixed above 1.0850. In fact, we are recording a kind of correction from the minimums, but the instability of the entire structure is obvious. Thus, although the price is fixed above the level of 1.0850, this does not guarantee that the upward movement will continue in the market. What I mean is that the downward development can resume at any moment, and you should be prepared for it.
In terms of emotional mood, we see that the increasing noise from the external background does not give rest to speculators, who on a daily basis accelerate the market to unimaginable heights in terms of activity. This kind of behavior will continue to persist in the market until the external background reduces the negative pressure.
Detailing the available period every minute, we see that since the beginning of the Pacific trading session, the quote has built an upward move, which led us to the area of 1.0888, but after that, there was a slowdown and the price returned below the level of 1.0850.
In turn, traders worked on a local upward trend, having trading positions still from the value of 1.0775. Now, the deals switched to fixing as soon as the price reached the level of 1.0850. Subsequent actions are considered for sale, but in this case, the price must be kept below the level of 1.0850.
We can assume that if the price is fixed lower than 1.0810, it will open another round of short positions, which will first return the quote to the area of the mirror level of 1.0775, and then go towards the lows of 1.0636/1.1650.
Based on the above information, we will output trading recommendations:
– Buy positions should be considered after fixing the price higher than 1.0890, with the prospect of a move to 1.0950
– We consider selling positions if the price is fixed below the area of 1.0810, with the prospect of a move to 1.0775-1.0650-1.0636.
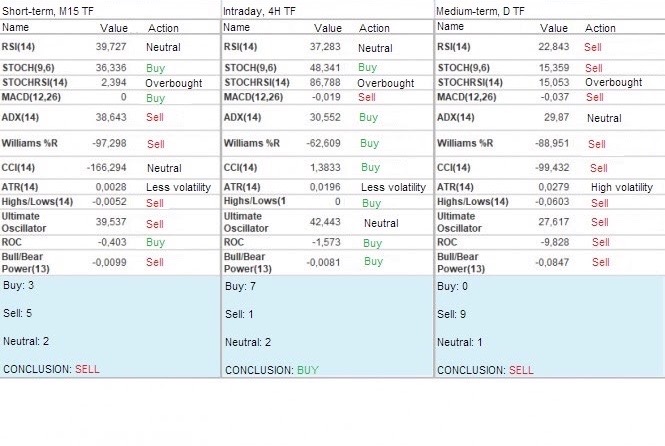
Indicator analysis
Analyzing different sectors of timeframes (TF), we see that due to the existing upward movement, the indicators of technical instruments on the minute and hour periods were under pressure, having a variable buy signal. Daily periods continue to maintain a sell signal against the general background of decline.
Volatility for the week / Measurement of volatility: Month; Quarter; Year.
Volatility measurement reflects the average daily fluctuation from the calculation for the Month / Quarter / Year.
(March 24 was based on the time of publication of the article)
The volatility of the current time is 132 points, which is already 63% higher than the daily average. It is likely to assume that activity will continue to grow, where the dynamics may again reach 190 points.
For more than 9 Years , EXM has lived by a core value—to always be a first- rate trustee leader in delivering innovative financial services in anticipation of the needs of our clients. This lasting value guides us during this challenging time. As the coronavirus (COVID-19) and the related market volatility continue to evolve, I want you to know that everyone at EXM is completely committed to helping you with all your financial service needs. Serving our clients and supporting our employees who help you are our top priorities. We know our clients want to be able to connect with us digitally or by phone, so we are taking extra steps to be responsive to your needs
Staying Connected
You can monitor your account, and perform activities digitally at your portfolio which provides you with easy access to complete these tasks:
View account information, see transaction history, and edit your personal profile
Open a new account or contribute to an existing account
Withdraw funds or Rollover your IRA
Keeping you informed
We are ensuring that our Support team
Are available to serve you 24/7 by creating as much additional capacity as possible to help. With demand, we are seeing record levels of client interactions. Our Support desk are working incredibly hard to help you as quickly as possible, and we ask for your patience if there are wait times.
We are also taking proactive steps to keep you informed of market events and provide you with our timely insights as new developments occur.
Promoting health and safety for everyone
The health and safety of our clients and Employees is most important. Our Headquarters is currently open with enhanced cleaning routines, following best practices; however, we encourage you to consider a phone-based appointment. As we continue to monitor the situation, we may temporarily transition all client service to digital channels and phone.
On behalf of everyone at EXM, I want to thank you for being a valued client.
Coronavirus fear (hysteria) has a substantial impact on our lives and financial markets. Our summary below is as of the end of Friday, 6 March. Over the weekend and this morning (Monday), markets have materially moved. The price of a barrel of Brent oil plunged to below US$34 and 10-year US Treasury yields fell to below 0.42%.
While last year’s heightened trade tensions weighed on global supply chains, the worldwide spread of the coronavirus has nearly brought activity to a standstill, creating the potential for a global economic shock. The outbreak hasn’t only disrupted supply chains and reduced access to goods, but also fears of the infection spreading and associated work stoppages are weighing on consumer spending. This comes at a vulnerable time as growth in many developed markets had just started to recover from last year’s lull. Companies closely tied to the consumer – including retail, technology and consumer goods – are already acknowledging the impact on sales and earnings expectations. Global economic growth will certainly take a hit; however, the full impact is likely to be felt over the course of several months.
The US
The potential policy responses of the US and other governments to the outbreak and how effective they would prove seemed to take centre stage on Wall Street last week. Stocks had their best daily gain in nearly three months last Monday, attributed, in part, to hopes for the announcement of coordinated policy measures at Tuesday’s meeting of G-7 finance ministers and central bank officials. Stocks fell back Tuesday morning, however, after investors appeared disappointed by a lack of firm details – particularly about fresh fiscal stimulus and coordinated interest rate cuts – coming out of the meeting.
Markets were caught by surprise by the Federal Reserve’s 10:00am announcement on Tuesday of an emergency 0.5% rate cut, citing “evolving risks to economic activity” from the virus. Stocks briefly rallied on the news, but then fell back sharply. Some observers noted the Fed’s surprise move in advance of its policy meeting later in March may have signalled that policymakers were getting a privileged view into signs of stress in credit markets. Investors may have also been disappointed that Fed Chair Powell’s statement didn’t include more details on the Fed’s outlook for the economy.
EXM Capital Chief US Economist Alfons Darnst expects the Fed to maintain the accommodative policy stance established with the 3 March emergency cut. Provided the outbreak is contained, which Alfons thinks is the most likely trajectory, he believes the Fed will look through the short-term negative impact. That said, he believes policymakers wouldn’t hesitate to ease again if deteriorating market and economic sentiment threatened to prolong the slump. Even less likely, in his view, are conditions that would prompt a rate hike this year. Indeed, the Fed would welcome an upside growth surprise that lifted the personal consumption expenditures price index to, or even modestly above, its 2% medium-term inflation rate objective.
Although ample anecdotal evidence of cancelled travel and other disruptions arrived last week as a result of the virus, the week’s data provided little confirmation of a slowdown. The Institute for Supply Management’s gauge of service sector stayed firmly in positive territory, and construction data were particularly strong. Weekly jobless claims stayed near the previous week’s low level, and the closely watched February payrolls report, released on Friday, surprised well to the upside. Employers added 273,000 jobs in February, and the previous months’ strong gains were revised upward by 85,000 jobs.
Asher Schur, Senior Fund Manager at EXM Capital, observes that investors are beginning to understand that management teams are now focused on contingency planning and business continuity as opposed to hiring and expansion. Meanwhile, individuals are evaluating many of their plans and are becoming more cautious, delaying and deferring travel in particular. Nevertheless, while he expects further market volatility, Sharps stresses he doesn’t see any meaningful structural imbalances in the economy right now, and he is hopeful the outbreak won’t have any meaningful or long-lived impact on the economy.
Equity markets
The S&P 500 returned 0.6% (-7.4% YTD). The major stock indexes ended mixed after a second week of extraordinary volatility driven by coronavirus fears. The large-cap benchmarks and the technology-heavy Nasdaq Composite recorded gains, thanks to sharp rallies on Monday and Wednesday, but the smaller-cap indexes ended modestly lower.
Within the S&P 500, the typically defensive utilities sector performed best. Healthcare shares were also strong after the prospects for Senator Sanders’ “Medicare for All” system seemed to diminish following former Vice President Biden’s solid performance in many presidential primary elections on Super Tuesday. Energy shares again led the declines as US oil prices plunged to multiyear lows on Friday following OPEC’s failure to convince non-OPEC member Russia to agree to production cuts.
Fixed income markets
The bond market seemed unimpressed by the payrolls report, and the week’s drastic moves in Treasury yields appeared to be another factor driving equity market volatility. After falling sharply the previous week, the 10-year US Treasury yield tumbled further following the Fed’s rate cut, moving below 1% for the first time in history on Tuesday and then reaching a new record low of around 0.66% on Friday morning.
The investment-grade corporate bond market had a more muted response to the Fed’s surprise rate cut, although Biden’s Super Tuesday victories seemed to spark increased buying and credit spread compression across most market segments. However, the positive sentiment faded as growth concerns led to less liquidity in the secondary market and spreads moved wider. In a positive sign, issuance resumed after the primary calendar was dormant the previous week.
Biden’s gains and the Fed’s rate move seemed to encourage high yield investors to put cash to work in better-quality names within the non-investment-grade category. The energy sector partly retraced its recent losses. However, volatility re-emerged in the second half of the week, weighing on sentiment as equities traded lower amid ongoing virus concerns. Below investment-grade funds reported negative flows industry-wide. The plunge in oil prices took a particularly large toll on energy sector issues, which are heavily represented in the high yield market.
A volatile stock market and changing demographics are increasing investors’ interest in bonds.
High-quality bonds can provide income, help preserve wealth, and diversify portfolios.
Adding a core bond allocation can be a good first step in diversifying your portfolio with bonds.
Investors can get exposure to core bonds in several ways: mutual funds, ETFs, individual bonds, and separately managed accounts.
Do you have enough bonds in your investment plan? And if you are looking to bonds to offset the volatility of stocks or preserve wealth, do you have the right kind of bonds? These are good questions to ask yourself, particularly in the wake of the recent stock market pullback.
Bonds are key building blocks of most portfolios because they offer a way to potentially preserve wealth, generate income, and diversify portfolios. For many investors–particularly during volatile or down markets–the ballast bonds provide a portfolio may matter more than price increases.
Why bonds?
Asher Schur, Senior Fund Manager of EXM Dynamic Credit Fund (DCF), says when asked about the bond asset allocation in the DCF “When you think about investing in bonds, you’re likely interested in preserving capital and the diversification benefits relative to some of the assets in your overall portfolio.” Diversification matters because stocks will return to more historically typical levels of volatility after a long period of calm and adding bonds to a portfolio provides a counterweight. Keep in mind, though, that diversification and asset allocation do not ensure a profit or guarantee against loss.
Capital preservation also matters because the current bull market is not the only thing that’s aging. As baby boomers exit the workforce and Generation X eyes retirement on the far horizon, an increasing number of investors are more concerned with holding on to what they have than with seeking growth.
If the traditional benefits of bonds appeal to you, adding what is known as a core bond position to your portfolio could be a good first step to consider.
What’s a core bond portfolio?
A core bond portfolio is a selection of bonds with high credit quality and a low likelihood of default. Investors new to the bond market should understand that it is a vast place and many bonds do not fit that description. Buying an index fund that replicates the entire bond market would likely include many high-risk securities you probably wouldn’t want. By building a core bond portfolio instead, you only get high-quality bonds with relatively low risks of default and reliable interest payments.
Often, a core bond portfolio holds bonds issued by the US government and corporations with high credit ratings and regular interest payments. For example, Asher and his team manage the DCF , A Fund which part of its goal is to maintain 2 roughly equal-sized allocations, one to US Treasury bonds for the relative stability they provide, and another to investment-grade corporate bonds for the higher yields they may offer.
Because core portfolios generally emphasize capital preservation and income from regular interest payments, rather than maximizing yield, they are unlikely to include big allocations to higher-yielding but riskier bonds issued by companies or governments with lower credit ratings.
The mix of bonds in a core portfolio includes a large number of issuers and a wide range of yields and dates when the bonds mature. Finding and combining those bonds in a way that delivers the stability and yield that you seek is a process that rewards skill and painstaking research. Depending on how much of that you possess or want to do, you can choose from among 3 strategies: buying a mutual fund or exchange traded fund (ETF) assembling a portfolio of individual bonds, or having a professional build and manage a portfolio of individual bonds for you in a separately managed account (SMA).
Investing in a bond mutual fund or ETF
Buying shares of a fund is an easy way to add a core bond position. Bond funds are like stock mutual funds in that you put your money into a pool with other investors, and professionals invest that pool of money in what they think are the best opportunities in light of the fund’s investment goals. Bond funds hold a wide range of individual bonds, which makes them an easy way to diversify your holdings even with a small investment.
An actively managed fund also gives you the benefits of having professionals conduct fundamental research to select bonds and manage risk. For example, the managers can make decisions about which bonds to buy and sell based on huge volumes of information including bond prices, the credit quality of the companies and governments that issue them, how sensitive they may be to changes in interest rates, and how much interest they pay.
Not all core funds are actively managed. Investors who seek core bond exposure in a fund can also all choose from among exchange-traded and index funds that track bond market indexes such as the Bloomberg Barclays Aggregate Bond Index.
Investing in individual bonds
If you have enough money and believe you have the time, skill, and will to build and manage your own portfolio, buying individual bonds may be appealing.
Unlike investing in a fund, doing it yourself lets you choose specific bonds and hold them until they mature, if you choose. That can help you avoid much of the risk that changes in interest rates and prices might pose to investors in mutual funds. However, you still would face the risks that a bond issuer might default or call the bonds prior to maturity. So this approach requires you to carefully research and closely monitor the finances of each issuer whose bonds you’re considering. You also need enough money to buy a variety of bonds to diversify away at least some risk. EXM Capital suggests you spread a portion of your assets across multiple bond issuers.
EXM’s individual bond offering aggregates over 40,000 bonds on a typical day, including US Treasury, corporate, and municipal bonds. Most of the bonds offered are in the mid to high quality tiers of credit ratings that would be appropriate for a core bond portfolio. Investors can use an array of tools such as a bond ladder tool and several inventory screeners, and avail themselves of analytics to help them manage their bond portfolio efficiently.
Personalized management
Separately managed accounts (SMAs) combine the professional management of a mutual fund with some of the customization opportunities of doing it yourself. In an SMA, you invest directly in the individual bonds, but they are managed by professionals who make decisions based on factors such as current market conditions, interest rates, and the financial circumstances of bond issuers.
Next steps to consider
Research bonds Get investment analysis to help you invest in bonds.
We are activating your personalized hedge (“short”) to its maximum level. The goal is that part of your portfolio earns profits when the market declines so you capture alpha.
This is based on our internal indicators of current market conditions.This volatility presents a ripe opportunity for alpha.
Reminder: the hedge is designed precisely for environments like this (and is where hedge funds get their name – they outperform in choppy waters). It is both defensive and offensive.
#1 Defense – it reduces your exposure to volatility
#2 Offense – it enables you to earn profits when the market declines
Your portfolio will now effectively be long 20 stocks and partially short the market, which hopefully can result in net outperformance (alpha). Notice: our tone is probably dramatically different than what you may be seeing in the news. Our goal, as your fiduciary, is to help you grow your capital with profits in all environments, even choppy ones.
The Nitty gritty Q&A
Remind me again about hedging (“shorting”)? This is what hedge funds do. We short the market during tumultuous periods so you can hopefully profit when it goes down. Hence our shorting is counter-cyclical. It enables you to keep the majority of your capital invested for the long term (i.e. not selling and facing tax consequences). The goal is that a portion of your portfolio reaps profits in all environments.
What’s your view on markets? Fundamentals look strong, but market technicals suggest volatility is likely in coming weeks. Market conditions have deteriorated materially in just the last few days, presenting opportunities – everything is going on sale. Underlying fundamentals of U.S companies remain strong on a multi-year forward basis, but our technical indicators suggest the sell-off could continue in the near term as the coronavirus crisis unfolds.
What’s your view on the coronavirus? The reported number of cases should continue to increase. There’s a 10 day lag in the coronavirus incubation period, which means the reported numbers we’re seeing will continue to get worse before they get better. So this “dip” (and potential “double dip”) will present a buying opportunity for you to obtain alpha. On both the long (stocks) and short sides (the market).
You don’t have to do anything
As your fiduciary, we automatically do all this behind the scenes. Your hedge level is based on your individual risk tolerance (Conservative, Moderate, Aggressive) as of Feb 14th. If your risk tolerance has changed, you can update it in the app under Account > Settings > Account > Account Profile > Financial > Investing Style. Any changes will be reflected at the next rebalance.
Let us know if you have any questions. We’re here and actively managing your portfolio through this volatility.
The Global Market Snapshot provides a quick tour around the world, highlighting key economic and market-moving news, featuring actionable insights for all investors
Key Market/Economic Observations
United States
Geopolitical Risks Test Markets’ Resiliency as Earnings Come into Focus
US equities began the New Year carrying over the momentum from 2019, with optimism from the United States and China signing a “phase one” trade agreement and a solid start to the fourth-quarter earnings season sending markets to a series of new highs.
“Even a temporary spike in oil markets, following the US killing of a high-ranking Iranian military leader, was not able to disrupt the market’s positive sentiment through the first few weeks of the month.”
However, late in the month, fears over the rapidly spreading coronavirus epidemic in China brought geopolitical risks and global growth concerns back into focus. The uptick in uncertainty triggered a similar market response to what we observed during periods of escalation in US/China trade tensions in 2019 — a spike in volatility, a flight out of equities, and rising stock correlations. The broader S&P 1500® closed down 0.3% for the month, the large cap S&P 500® was unchanged, the S&P 400® mid cap was down 2.6%, and the S&P 600® small cap closed the month down 4.0%.
We would caution that we are still early in the coronavirus outbreak, and the ultimate impacts on both global economic growth and market direction are still uncertain. However, even with the late month sell-off, domestic equities remained within about 3% of their mid-January all-time highs. Despite growing concerns over the coronavirus, equity investors appear to be focused more on solid underlying economic growth and better earnings reports from companies.
Entering the year, we viewed the US economy and equity market as much more fundamentally sound than at the start of 2019. Central to this view were expectations for a material rebound in US corporate earnings. While we are only about halfway through the fourth-quarter earnings season, results thus far have been better than expected, with the blended earnings growth rate (actual reported results combined with consensus estimates for those yet to report) of -0.3% versus consensus expectations at the beginning of the quarter of -1.7%. Furthermore, calendar year 2020 earnings revisions have remained in check, with consensus earnings growth estimates still forecasted to come in at a robust 9%.
The forward price-to-earnings (P/E) ratio of the S&P 500 hit a new business cycle high of 18.6 times in early January, leading some to question if market valuations would constrain future performance. In our view, the higher valuations are largely a function of an improving global macro outlook, lower interest rates, and index composition. For example, Apple Inc. (AAPL) and Microsoft Corp. (MSFT) now make up nearly 10% of the S&P 500 market cap, and forward P/Es for both companies ended January at or near business cycle highs. We continue to believe this context matters for valuations. Additionally, consensus expectations are for next-12-month earnings-per-share (EPS) for the S&P 500 to reach all-time highs; therefore, with earnings growth inflecting higher in 2020, we do not see current valuation levels as overly concerning.
From a technical perspective, US equity market sentiment had reached aggressively bullish conditions following the very strong performance in fourth-quarter 2019 (the S&P 500 was up 9.1%). Leading into the news of the coronavirus outbreak, equity markets were running at a historically low S&P 500 put/call ratio, experiencing significant fund flows into US equity exchange-traded funds and sitting with the highest percentage of stocks trading above their 200-day moving average since 2014. This type of overbought technical backdrop typically leads many investors to look for a reason to sell in anticipation of a potential pullback, and we believe the virus outbreak could have been the catalyst for a near-term sell-off in stocks.
“In our view, market pullbacks following a period of strong performance are normal for a well-functioning market. Furthermore, market pullbacks that coincide with a strong fundamental backdrop typically represent good buying opportunities over the long term rather than a time to panic.”
In our view, market pullbacks following a period of strong performance are normal for a well-functioning market. Furthermore, market pullbacks that coincide with a strong fundamental backdrop typically represent good buying opportunities over the long term rather than a time to panic.
US real GDP grew at an above-consensus 2.1% annualized rate in the fourth quarter. A significant contribution to this growth came from an increase in net exports, which offset a lower rate of growth in consumption, along with a decline in capital expenditures (capex). For the full year, GDP grew at a 2.3% rate. In our view, the US consumer remains healthy, as evidenced by strong retail sales, high saving rates, low borrowing rates, and strong consumer sentiment readings. These factors should continue to help support steady consumption and be a key driver of economic growth.
However, we continue to see a divergence between corporate and consumer spending. For the third straight quarter, corporate investment contracted and catalysts for meaningful increases in near-term capex, which we see as critical for boosting productivity, have remained elusive. While the US/China trade deal may have removed a key overhang on business sentiment, the new unknown impact of the coronavirus, combined with potential uncertainty surrounding the November presidential election, may present additional challenges for capex growth.
After climbing 38 basis points in the final four months of 2019, the US 10-year Treasury yield fell to 1.54% in January as the Federal Reserve decided to keep monetary policy unchanged and concerns over the coronavirus dampened sentiment. The fall in yields helped push some parts of the yield curve back into inversion but was supportive of fixed income returns, with the Bloomberg Barclays Aggregate Index returning 1.9% for the month.
In corporate credit, high yield and investment-grade spreads moved wider, albeit to varying degrees, amid strong issuance as companies seek to take advantage of low rates and easier credit conditions. As a result, investment-grade corporate debt outperformed high yield by more than 2%, with high yield effectively flat for the month due primarily to spread widening. We believe improved financial conditions bode well for businesses and consumers alike, as evidenced by the recent surge in housing starts, which reached their highest level since 2006.
Tax-exempt municipal bonds were among the best performing sectors within fixed income for the month (+1.8%), continuing last year’s strong performance. The outperformance over similar maturity Treasuries helped push the 10-year Municipal-to-Treasury ratio back near cycle lows, with valuations underpinned by 56 consecutive weeks of fund inflows and taxable issuance accounting for an increasing share of municipal supply.
International Developed Markets
Improving Financial Conditions, Valuations Help Support the Case for Developed International Assets
Hopeful signs for improving economic growth and attractive valuations remain tailwinds for developed international assets. In January, the IHS Markit Eurozone Manufacturing PMI® improved, with the three largest economies in the region (Germany, France, and the United Kingdom) all increasing in unison, which we find encouraging.
With the region particularly pressured by trade tensions over the last couple of years, gains in the manufacturing sectors of these countries are important to a broader economic recovery for the region. The signing of the US/China trade agreement should offer a reprieve from this overhang, in our view.
The United States and France also reached a truce regarding the imposition of tariffs on the digital revenues for companies, removing yet another layer of trade uncertainty.
At its January meeting, the European Central Bank kept its interest rate policy unchanged at -0.5%, maintaining its accommodative stance as select “green shoots” appear to be forming in the region. For example, Eurozone unemployment remained near a cycle low, retail sales volume was strong, and a variety of business confidence surveys (for example, the European Sentix Investor Confidence Index, German ZEW Indicator of Economic Sentiment) have moved considerably higher in recent months.
Similar to their domestic counterparts, many equity markets across Europe and in Japan hit 52-week highs in mid-January before moving lower due to risk-off sentiment caused by coronavirus concerns. Before the outbreak started, however, market breadth, as measured by the percent of constituents reaching 52-week highs, increased significantly across these markets. This is encouraging to us, as it indicates most investors were discounting a more favorable outlook for the underlying fundamentals of companies across the Eurozone and Japan. We believe these dynamics will ultimately come back into focus once uncertainty around the coronavirus impact fades, but investors should anticipate continued volatility in the near term.
With roughly 20% of companies in the MSCI World ex USA Index reporting fourth-quarter earnings so far, the blended earnings growth rate for the quarter is about -3.0%, below the -0.3% expectation at the beginning of the quarter. Earnings revisions for the index have been steady over the last three months, with EPS growth expected to be up more than 6.0% in 2020. Despite the forward P/E ratio expanding by roughly one multiple turn for the benchmark over the last three months, the index’s valuation discount relative to the S&P 500 has actually widened.
While a number of unsolved headwinds remain, we believe stabilizing geopolitical conditions, accommodative monetary policy, and favorable relative valuations could be setting the stage for a longer-term period of outperformance.
The Bank of Japan (BOJ) kept monetary policy and forward guidance unchanged at its January meeting, revising GDP forecasts higher but reducing estimates for inflation through 2021. The decision came following a record budget for fiscal 2020. Should inflation continue to wane, we believe the BOJ may consider additional policy action, in line with the actions taken by other developed countries over the past 12 months.
Developed market bond yields followed US Treasury yields lower during the month, resulting in a $4 trillion increase in the market value of negative-yielding debt. However, we expect this number to remain volatile in the coming months, with bond yields of many countries employing negative interest rate policies slightly below the zero bound.
Emerging Markets
Coronavirus Fears Drive Emerging Markets Lower
After being up approximately 3% mid-month, the MSCI Emerging Markets (EM) Index ended down more than 4.5% for the month, negatively affected by coronavirus fears across most of EM Asia. Chinese authorities put several major cities under quarantine ahead of the Lunar New Year, effectively cutting off a key source of global market liquidity. While the coronavirus took center stage for most of the latter half of the month, the Chinese economy delivered solid data throughout the month. Headline figures point to the slowest economic growth in nearly 30 years, but GDP came in as expected and reportedly grew more than 6% for 2019. Both industrial production and retail sales data either beat or met consensus estimates, and industrial production accelerated for the second consecutive month, reaching the highest year-over-year growth rate (6.9%) since March 2019.
Fourth-quarter earnings season for EMs is just starting, with fewer than 5% of companies having reported. Unlike the S&P 500, which is expecting low-single-digit growth, EMs are expecting EPS growth of more than 10%.
Consensus estimates for 2020, which are already expecting EPS growth of approximately 15%, have been revised higher in recent weeks. In our view, these positive developments reflect optimism around potential green shoots in the global economy.
Despite coronavirus concerns, Chinese and other Asian markets, which were closed for various time periods for the Lunar New Year holiday, did not even have the lowest returns for the month. Country-specific issues in South Africa continue to plague the sixth largest country weighting in the index, with the total return for the country index down nearly 9% for the month. Despite a positive return over the last 12 months, the South African Index has trailed the EM Index in 9 of the last 12 months. In our view, given the highly idiosyncratic nature of the EM universe, we believe investment allocations to active managers that can underweight or remove stocks in certain regions or countries are preferable to a passive approach to EM equities where this flexibility does not exist.
In spite of volatility in equity markets, the Bloomberg Barclays EM Bond Index is on pace for its fourteenth consecutive month of positive performance; not even the Bloomberg Barclays US Aggregate Index can match that feat.
A further gauge of positive developments in EM continues to be the resilience of the EM debt market: Rather than showing signs of stress, spreads are only at their 12-month average. In our view, this is another indication that EM equities and debt remain attractive.
For more information, please contact your EXM Capital advisor